ACEEE started our DataPoint series of informative graphs in December 2015, with the first one on energy intensity and how it relates to energy efficiency. It provided data on US energy intensity and efficiency improvements from 1980–2014. Now two more years of data are available, and a revised figure is below.
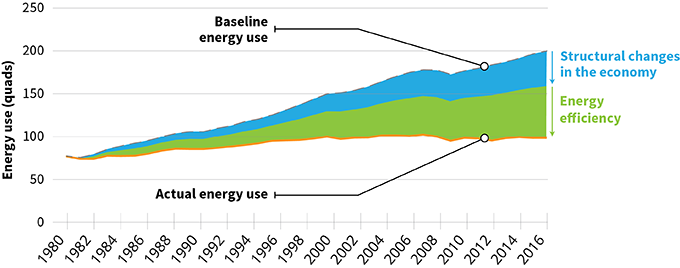
In the past two years, US energy use has declined 1%, while gross domestic product (GDP) has increased 4.25%. As a result, our energy intensity (energy use per dollar of GDP) has improved by 2.5% per year, a little better than the 2.0% per year compound rate we averaged over the 1980–2014 period. As noted in our 2015 blog post, based on a variety of studies, we estimate that about 60% of the improvement is due to energy efficiency improvements and 40% to structural changes in our economy (e.g., our growing service economy).
Two years is a short period, and it will take several more years of data to see if this increase continues. Also, it is hard to determine what is causing the increase, but possible explanations include mounting savings from appliance and equipment efficiency standards and vehicle efficiency standards, warmer weather, and increasing utility and other local energy efficiency programs (e.g., ACEEE’s 2016 State Energy Efficiency Scorecard found that incremental savings from programs were 0.7% of electricity sales in 2015; 2016 data not yet available).
US energy savings from efficiency and changes in the economy
This Article Was About
Efficiency PotentialAuthors