Many energy efficiency programs are designed around measures rather than people. These “untargeted” programs focus on meeting energy savings and cost-effectiveness goals, and are ostensibly impartial about the characteristics of the households that receive the offering.
Our new examination of program demographics shows how, in practice, untargeted programs often limit participant diversity. We reviewed every residential program evaluation in California for the 2010-2012 program cycle, and found participants in some of the biggest programs were substantially less diverse than the population. Energy Upgrade California (EUC) and Home Energy Efficiency Rebate (HEER) program participants, for example, were more likely to be white, upper income, college educated, or English speakers.
We explain these findings, and point the way toward greater equity and diversity in participation, by drawing on a categorization scheme for social programs and identifying three program design elements that influence participant diversity.
Three reasons why program participants may not look like the general population
1. Buy-in cost: the amount a household is required to spend in order to participate.
The buy-in cost for efficiency programs ranges from a US average of $6,000 for a home energy retrofit, to $500-$3,000 for an energy-efficient appliance, to -$50 for refrigerator recycling (the program pays the participant).
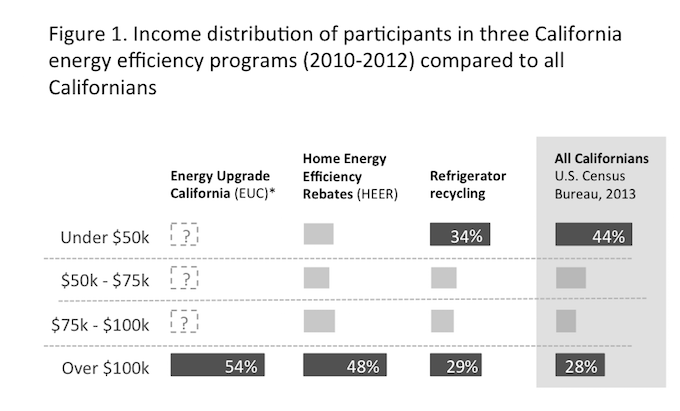
Our data show that a high buy-in cost correlates with a less diverse participant population. Participants in programs with the highest buy-in costs, EUC and HEER, were less diverse than California’s general population. Participants in the program with the lowest buy-in cost, refrigerator recycling, looked almost exactly like the population. Figure 1 shows the income distribution of participants in three programs: EUC, HEER, and refrigerator recycling, compared to California’s general population.
A natural experiment during the study period provides another illustration of the relationship between buy-in cost and participant demographics. For several months during the 2010-2012 program cycle, the availability of American Recovery and Reinvestment Act funding doubled the financial incentives for the EUC program. Households that participated when incentives were higher (and presumably their out-of-pocket cost was lower) had lower incomes, lower home values, and were more likely to live inland.
2. Outreach and marketing: the language, format, and channel through which program information is communicated.
The language in which a program communicates to participants is an important determinant of participant diversity. Nearly 40% of Californians say their primary language is something other than English. But California’s biggest-budget efficiency programs communicated nearly all program information in English, and most evaluation surveys were conducted in English.
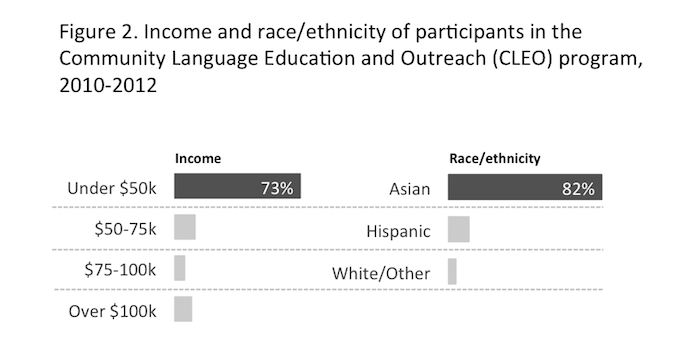
Efficiency programs that communicated in languages other than English succeeded in reaching more diverse populations. Figure 2 shows the income distribution and race/ethnicity of participants in the Community Language Education and Outreach (CLEO) program, which provided energy efficiency information in Asian languages and Spanish.
3. Implementation method: the many ways in which a program can be delivered
Program designers face an overwhelming number of options when it comes to program implementation, and their choices influence participant diversity. The best example from our data set is an experimentally designed pilot program for refrigerator recycling. When big box retailers implemented the program, participants had higher incomes, larger homes, and recycled newer, larger, side-by-side refrigerators, compared to participants in a utility-run program.
There are many research opportunities to explore the relationship between implementation approach and participant diversity. Our data only allowed us to begin to address questions about the demographic impact of choices, like in-person vs. online education.
Calls to action
There is a critical need for evaluators to consistently collect, report, and analyze demographic data. Nearly one-third of the evaluations we reviewed did not collect participant demographic data. Even among evaluations that did collect demographics, nearly one-third did not publish those data. And only a quarter of evaluations used demographics to analyze program performance.
Program administrators, designers, and implementers can play a key role in increasing participant diversity by using demographic data to identify underserved populations, assess their barriers to participation, and design programs to meet their unique needs. A recent ACEEE report provides information on best practices for reaching diverse participants in the multifamily sector.
Policy makers, too, can use participant demographic data as a resource to establish diversity goals for efficiency program portfolios. And future research should expand the investigation of participant diversity to programs in other regions of the country.
Marti Frank is an evaluator and program designer who works on climate change and social equity issues. Seth Nowak is co-author of the California diversity study and contributed to this blog post.