Standards cutting greenhouse gas emissions from cars and light trucks and raising fuel economy are among the biggest environmental achievements of the Obama administration. The standards are projected to save consumers hundreds of billions of dollars in fuel expenditures over the next decade. In the process, they are helping to shape the US and global auto industries by establishing an expectation of continuing technological progress toward high efficiency, low-emitting vehicles.
A new report from the EPA presenting manufacturer performance data from the first two years of the greenhouse gas emissions standards shows how the program is shaping up. Manufacturers by and large met the standards in both 2012 and 2013, with room to spare. Average compliance values in 2013 were 12* grams per mile, or 4%, below (better than) what the program called for in 2013, and in fact a bit below the more stringent requirement for model year 2014.
The performance of a sampling of manufacturers (figure 1) helps to explain two important aspects of the program: how the size mix of vehicles sold affects the emissions requirements, and what the role of special credit provisions has been.
Figure 1: Performance of selected manufacturers, 2012 and 2013
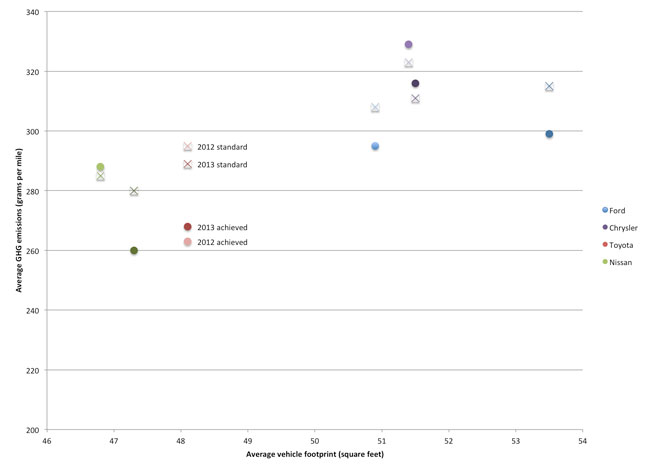
Data from EPA’s 2013 Manufacturer GHG Performance Report
Footprint Rules
The case of Ford underscores a key feature of the standards that press accounts often obscure: average fuel economy and greenhouse gas emissions levels required under the standards for a given year depend on the size mix of vehicles sold that year. Average emissions of both Ford’s cars and its trucks declined from 2012 to 2013, yet their average emissions overall increased, due primarily to a whopping 11% shift from cars to trucks in Ford’s sales mix. This shift also meant that Ford’s average vehicle footprint (the area of pavement defined by the four wheels), and consequently its emissions standard, increased in 2013. Ford easily met its standard in both years.
This illustrates one reason that the “54.5 miles per gallon equivalent” commonly used to describe the requirement of the 2025 standards is not quite what it seems – the actual value required in 2025 will depend upon the mix of vehicles sold in that year. By the same token, how easy or difficult it is to achieve the standards in a future year is unrelated to what size vehicles consumers choose in that year.
Emissions also crept up for Toyota, even though average footprint went unchanged from 2012 to 2013. Toyota still met its standard handily, however, thanks in no small part to the Prius: we estimate that 58% of Toyota’s emissions margin can be traced to the high fuel economy of the iconic hybrid, though it accounted for only 11% of sales. Meanwhile, Nissan went from a 3 gram per mile deficit in 2012 to a 20 gram per mile surplus in 2013 and achieved the largest year-over-year reduction in emissions of the large manufacturers. The battery-electric LEAF, treated as a “zero emissions vehicle,” substantially helped Nissan’s performance (18% of compliance margin, at 2% of sales), but several other models also contributed to its 28-gram-per-mile average emissions improvement from 2012 to 2013.
Extra Credit
EPA’s report also lays out manufacturers’ use of credit provisions and other flexibility mechanisms of the program. Air conditioning (A/C) credits and flex-fuel vehicle (FFV) credits make up the vast majority of these special credits claimed in both 2012 and 2013. Manufacturers are acquiring A/C credits faster than the agencies expected by reducing the leakage of refrigerants and producing more efficient A/C systems, both of which yield real-world reductions in greenhouse gas emissions.
By contrast, FFV credits, which are awarded for the sale of vehicles that can run on ethanol (E85), do not generally reflect any real emissions reductions, because FFVs in the United States run almost entirely on gasoline. Figure 2 shows how much credit manufacturers claimed under the program. (Manufacturers not shown claimed none.)
Figure 2: Flex-fuel vehicle credits by manufacturer, 2012 and 2013
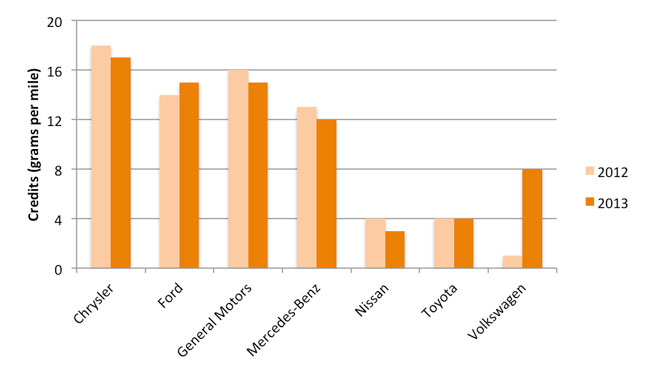
Data from EPA’s 2013 Manufacturer GHG Performance Report
The Detroit manufacturers have taken far more advantage of the FFV credits than the industry has on the whole; they’ll need increasingly to do without as the credits are phased out in the coming years. As figure 1 shows, Chrysler came just shy of meeting its emission standard in both 2012 and 2013. The company has nonetheless stayed in compliance using other flexibilities of the program, including the purchase of a modest number of credits from other manufacturers in 2013. But without FFV credits, Chrysler’s emissions would have exceeded the standards by more than 20 grams per mile, or roughly two year’s worth of emissions reductions under the standard. Thus, continued reliance on FFV credits could leave the company behind in terms of real technological progress a few years hence.
As the fuel economy and greenhouse gas standards go under the microscope in an upcoming “midterm review” of the program, detailed accounts of progress such as the EPA report provides will be essential. The first two years of data indicate the program is on track and unfolding largely as planned.
Peter Slowik contributed to this blog post.
EDIT: Originally, we published 13 grams per mile. The correct value is 12.
This Article Was About
Mobility Choices Fuel EconomyAuthors