Programs with opportunities for large savings
We look at the following program areas with opportunities for large savings, and they are ordered by potential electric savings, from largest to smallest, as analyzed in this report:
- Industry. We discuss strategic energy management, energy management information systems, energy studies, energy manager support, and several emerging approaches.
- Commercial retrofits. We discuss buildings over 25,000 sq. ft. and cover assisting with enactment and implementation of Building Performance Standards (BPS), supporting building renovations, strategic energy management, monitoring-based commissioning, and automated demand response.
- Distribution efficiency. We address voltage optimization and amorphous core distribution transformers.
- Heating, ventilation, and air-conditioning (HVAC). We discuss midstream market programs, residential and commercial heat pump market transformation programs, advanced rooftop unit control programs, and chiller programs.
- Lighting. This includes both controls and LED lighting.
- New construction. We cover both residential and commercial.
- Single-family home retrofits.
- Low-income household retrofits.
- Small business retrofits. We discuss retrofits in buildings 25,000 sq. ft. and smaller, primarily using a direct installation approach.
- Smart thermostats. We address both energy savings and peak demand reduction.
- Multifamily building retrofits.
- Appliances and equipment. We focus on affecting future minimum efficiency standards.
- Water heating. We emphasize demand-response controls, but also discuss heat pump water heater programs in the years before new federal efficiency standards take effect, as well as products not covered by the Department of Energy (DOE) standard.
We identified these program areas through discussions with program experts and analysis of energy savings achieved by leading utilities and other program implementers. For each program area, we identified leading programs and compiled case studies on these programs including participation rates, savings, costs, and lessons learned.
Energy savings and demand reduction
Overall, excluding the fuel switching programs that we discuss below, the programs we profile reduce projected 2035 electricity use by about 574 TWh and reduce fuel use by about 1,700 trillion Btu (TBtu). To put these figures in perspective, the U.S. Energy Information Administration’s 2026 Annual Energy Outlook estimates that in 2035, U.S. utilities will sell 4,937 TWh; therefore, implementing our suggested energy efficiency programs would reduce U.S. electricity sales by about 12%.1 The commercial savings represent 39% of the total electricity savings, industrial 29%, residential 16%, and grid programs 17% (figure ES-1). Because these programs emphasize electricity savings, the 2035 fuel savings from these programs are smaller, about 8% of projected fuel sales to residential, commercial, and industrial customers. Additional savings are likely possible from programs that focus on these fuels, but that is outside the scope of this report. The estimated annual electricity savings are more than the total 2024 electricity consumption of Texas, the state with the highest electricity use.
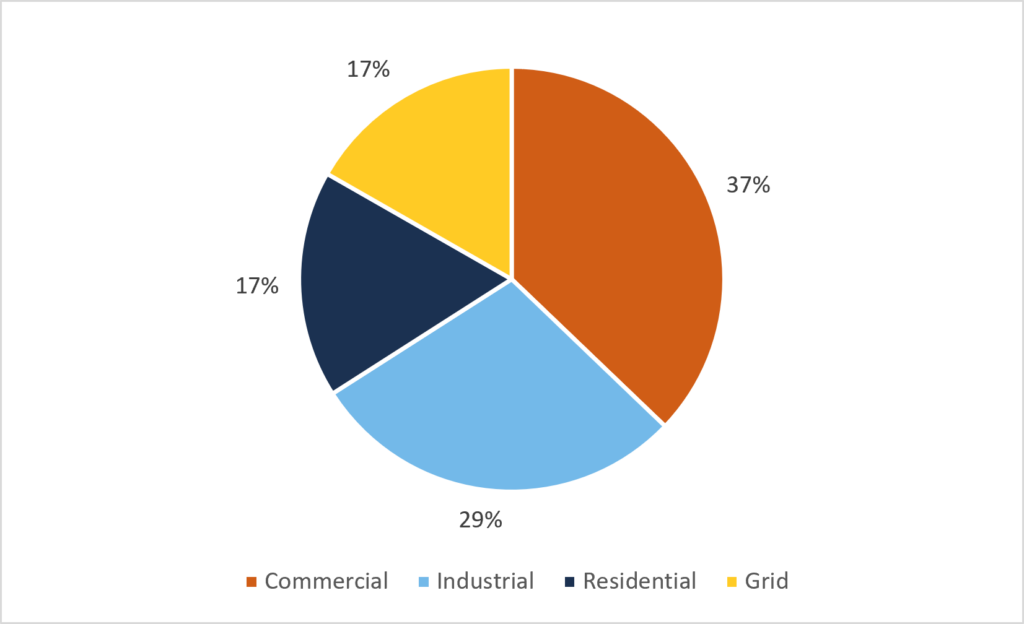
Figure ES-1. Division of 2035 electricity savings (without fuel switching) by sector
The electricity savings free up some capacity for new loads from data centers, electrification with heat pumps, and electric vehicles. The fuel savings include some replacement of oil- and propane-fueled space and water heating with electric heat pumps, and use of heat pumps to complement natural gas heat. This increased use of heat pumps saves energy because heat pumps are about twice as efficient as the systems they displace. These additional heat pumps will increase electricity use by approximately 64 TWh per year, offsetting about 11% of the 574 TWh of total electricity savings that would be achieved with just electric efficiency measures (lowering the projected reduction in 2035 from about 12% to about 10%).
The programs we profile also have large peak demand savings, totaling about 173 GW in the summer and about 108 GW in the winter. To put these demand savings in perspective, a typical large nuclear power plant is about 1 GW, and typical new gas combined-cycle power plants range in size from about 0.7–1.25 GW. Thus, these programs will defer the equivalent of more than 100 large nuclear or gas combined-cycle power plants serving winter peak loads and even more serving summer peak loads. Another way to interpret these demand savings is relative to the demand of large new data centers. The largest operating data centers are 250–750 MW (0.25–0.75 GW), and several planned data centers are over 5 GW. Savings by program are summarized in figure ES-2.
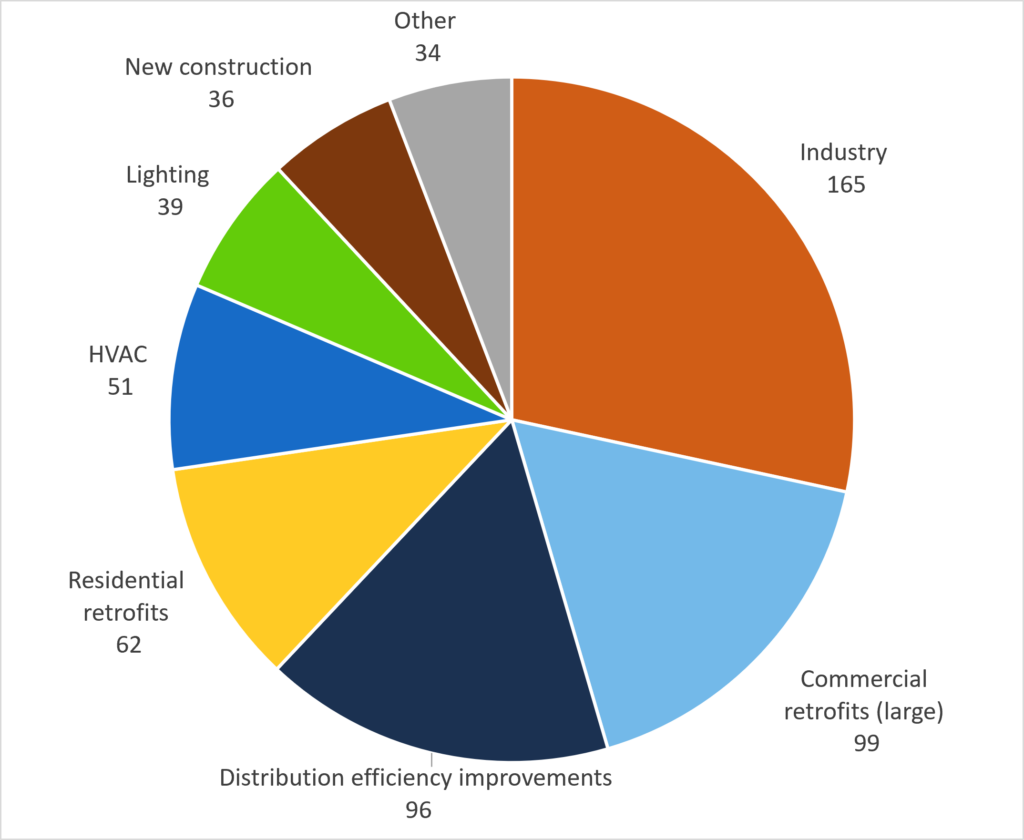
Figure ES-2. Estimated electricity savings by program without fuel switching (TWh)
Cost of saved energy
For most program types, we were able to collect information to calculate the cost per kWh saved over the measure lifetime, also known as the cost of saved energy. We find that for most of the programs, the cost per kWh saved is less than $0.05 and for a majority it is less than $0.03. Only a few program types, all addressing homes, have costs that are greater than about $0.08 per kWh. These costs are substantially less than retail electric rates (which in 2025 averaged $0.17 per kWh for residential sales, $0.13 for commercial, and $0.09 for industrial). These energy efficiency costs per kWh will also generally be less than utility avoided costs, with the possible exception of a few of the residential programs.