Corporate Average Fuel Economy (CAFE) standards for cars and light trucks, first adopted in 1975 in the wake of the OPEC oil embargo, resulted in a doubling of average new vehicle fuel economy a decade later. Following that period of rapid advance were two decades of stagnant fuel economy standards. In fact, because cars and light trucks were subject to different standards, and light trucks’ share of the market grew—largely reflecting the rise of the sport utility vehicle—there was a slight but steady decline in average fuel economy for cars and light trucks combined from 1990 to 2004, as shown in the figure below. (How those standards played out in real world fuel economy and other vehicle characteristics is discussed in an earlier post.) During the Clinton administration, Congress imposed a rider on the Department of Transportation appropriations bill for FY 1996 through 2001 prohibiting the use of funds to “prepare, propose, or promulgate” new fuel economy standards.
The George W. Bush administration modestly increased standards for light trucks beginning in 2005. The Energy Independence and Security Act of 2007 (EISA) accelerated the upswing in fuel economy by requiring that federal standards be set to achieve at least 35 miles per gallon on average by 2020. Also in 2007, the Supreme Court ruled in Mass v. EPA that the EPA had the authority, and indeed the obligation, to regulate greenhouse gas emissions—which, for motor vehicles, are closely related to fuel economy—under the Clean Air Act. By that time, California had already adopted GHG emissions standards for vehicles, which were to take effect in 2009. The Obama administration leveraged these circumstances, together with federal support for the automakers in crisis, to go well beyond EISA requirements and adopt joint CAFE and GHG emissions standards that were projected to achieve an average fuel economy of about 49 miles per gallon in model year 2025. Standards for future years are represented as dotted lines in the figure.
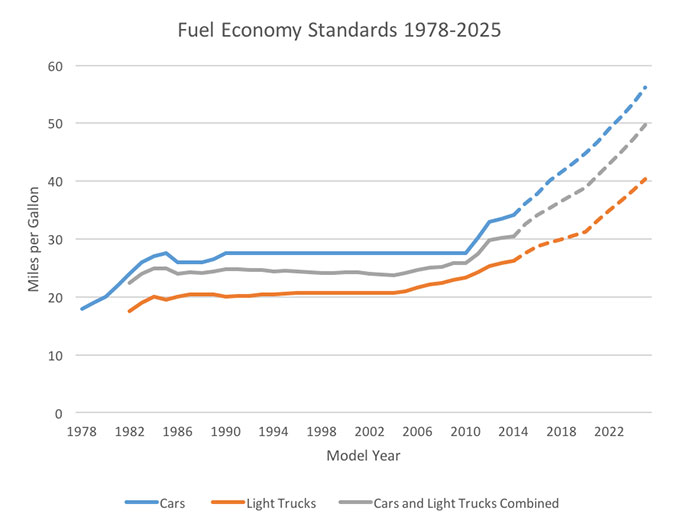
Data sources: NHTSA, Summary of Fuel Economy Performance (Public Version) Dec. 15, 2014; Fed. Reg. 75 No.88, May 7 2010; Fed. Reg. 77 No.199, October 15 2012. Miles per gallon values throughout this post are the laboratory test values used for fuel economy certification purposes. Label, or “real-world,” values are approximately 20% lower on average.
Standards set pursuant to EISA vary with vehicle size; smaller vehicles have higher fuel economy targets than larger vehicles do. This structural change in the CAFE program was intended to ensure that the standards would promote the adoption of efficiency technologies rather than the production of smaller vehicles. But it also means that average fuel economy for new vehicles in a given year will depend not only upon the car/light truck split, as it did in the 80s and 90s, but also on the size mix of vehicles of each type. If vehicles purchased are larger than anticipated when the standards were adopted, the average fuel economy required in future years will fall short of the projected values, and GHG emissions from the US vehicle fleet will exceed the levels anticipated.
For more on light-duty fuel economy, see our light-duty vehicles topic page.
Data Points is a blog series focusing on the graphs and other images that tell the energy efficiency story.
This Article Was About
Vehicle Lifecycle Efficiency Mobility ChoicesAuthors