From 1980 to 2014, energy use in the United States increased from 78 quads (quadrillion Btus) to 98 quads, an increase of 26%. (A quadrillion is 10 to the 15th power.) But over the same period, our gross domestic product (GDP) increased by 149%. A common approach for looking at these two variables together is to examine energy intensity, defined as energy use per real dollar of GDP. Energy intensity declined from 12.1 in 1980 to 6.1 in 2014, a 50% improvement (units are thousand-Btus per 2009 dollar) (from EIA 2015a). This improvement in energy intensity averaged 2.0% per year over this period.
Energy use, 1980–2014: actual use and estimates of structural and efficiency effects.
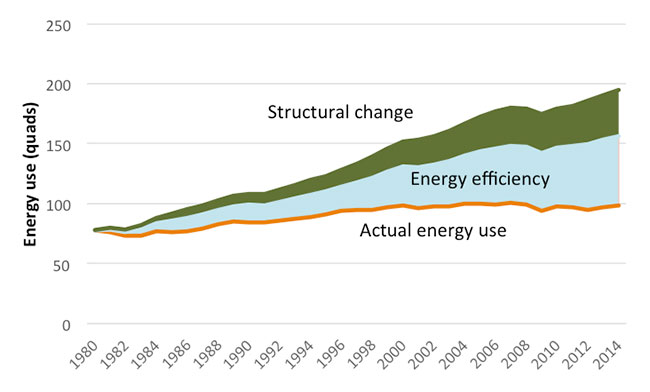
Source: ACEEE analysis based on data in EIA 2015a and Huntington 2009
Energy efficiency was an important contributor to this trend. However, the improvement was also partly due to shifts in the economy away from some energy-intensive segments (e.g., heavy manufacturing). For example, Hillard Huntington, in his 2009 report, examined energy productivity gains over the 1997–2006 period, and estimated that 39% of the improvement during this period was due to structural shifts in the economy and 61% was due to intensity improvements within each of 65 sectors he examined. This implies that energy efficiency improvements might have averaged about 1.2% per year (60% of the 2% per year discussed above).
Put another way, if energy intensity remained unchanged, in 2014 the United States would have used 195 quads. If we estimate that 40% of the improvement arose from structural change (rounding from Huntington’s 39%), energy use would have been 156 quads with structural change alone. Actual energy use was only 98 quads, leaving efficiency-related savings of about 58 quads.
For more on national energy metrics, see Energy Efficiency in the United States: 35 Years and Counting.
Data Points is a blog series focusing on the graphs and other images that tell the energy efficiency story.
This Article Was About
Energy Data Sets and ResourcesAuthors