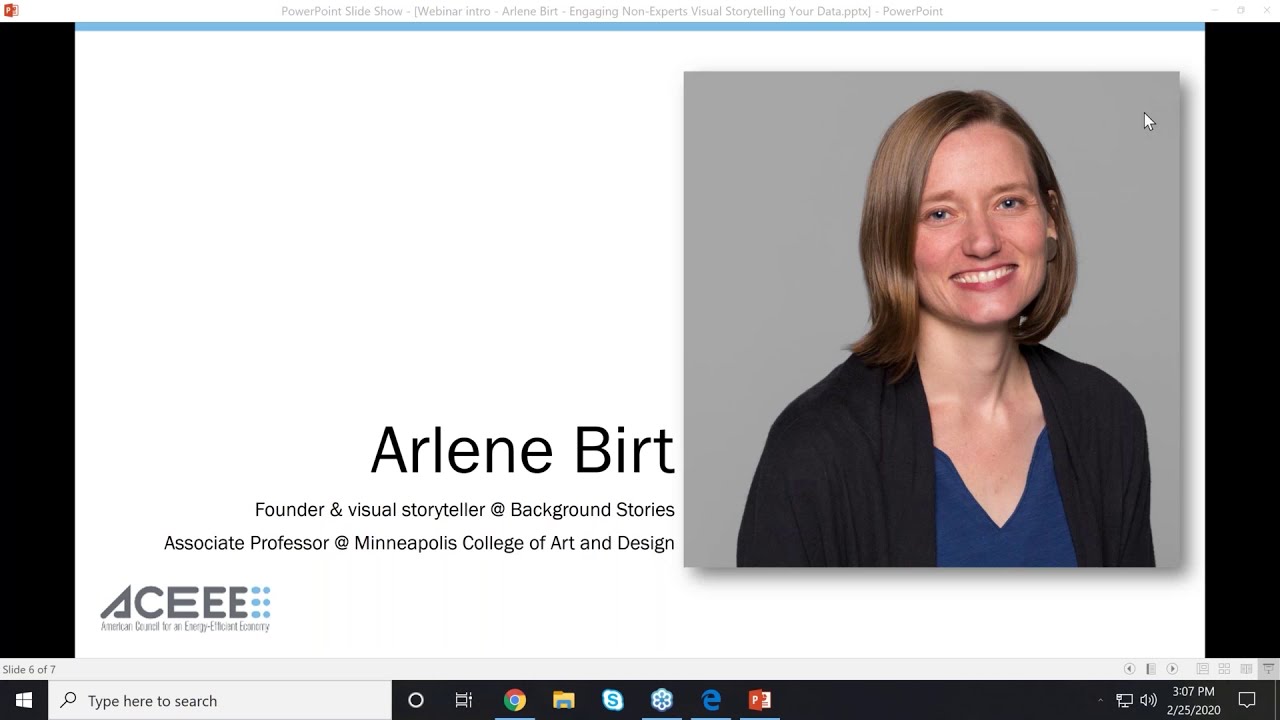
Visuals (including data visualization, infographics and visual storytelling) are an important method of showing complex systems – and they can be a useful tool to inspire action with your audiences. This session is an introduction to applying visual narrative to your data – with lots of examples. Learn how you can translate your research, data, and other environmental information into visuals to increase engagement.

Support the Work That Makes Energy Go Further
ACEEE’s independent research and advocacy depend on the support of foundations, businesses, and individuals committed to cutting energy bills, waste, and climate pollution.