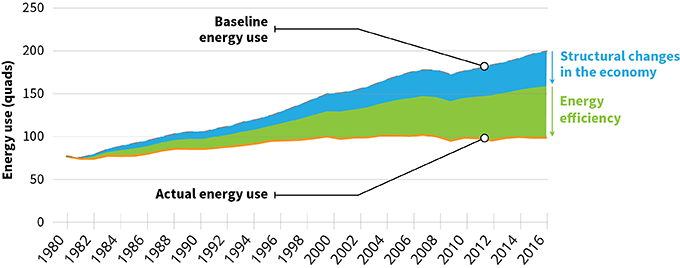
ACEEE started our DataPoint series of informative graphs in December 2015, with the first one on energy intensity and how it relates to energy efficiency. It provided data on US energy intensity and efficiency improvements from 1980–2014. Now two more years of data are available, and a revised figure is below.
In the past two years, US energy use has declined 1%, while gross domestic product (GDP) has increased 4.25%. As a result, our energy intensity (energy use per dollar of GDP) has improved by 2.5% per year, a little better than the 2.0% per year compound rate we averaged over the 1980–2014 period. As noted in our 2015 blog post, based on a variety of studies, we estimate that about 60% of the improvement is due to energy efficiency improvements and 40% to structural changes in our economy (e.g., our growing service economy).
U.S. House Votes to Axe Rebates that Help Families Reduce Energy Bills
The bill would repeal a $4.5 billion program that helps families reduce their energy bills through home upgrades
Support the Work That Makes Energy Go Further
ACEEE’s independent research and advocacy depend on the support of foundations, businesses, and individuals committed to cutting energy bills, waste, and climate pollution.